译 - Gorilla: A Fast, Scalable, In-Memory Time Series Database
《Gorilla: A Fast, Scalable, In-Memory Time Series Database》 这篇论文讲述了 Facebook 在存储时序数据模型时的一些实践,重点讲述了他们内部的一款内存型的时序数据库 Gorilla。论文中通过使用 Delta-Of-Delta 和 XOR 方式分别对时序数据的时间戳以及浮点数据进行压缩编码,极大的节省了时序数据的存储开销,这也成为了业界时序数据库主流的数据编码压缩方式。这篇论文是时序数据库领域必读的一篇文章。
摘要
Large-scale internet services aim to remain highly available and responsive in the presence of unexpected failures. Providing this service often requires monitoring and analyzing tens of millions of measurements per second across a large number of systems, and one particularly effective solution is to store and query such measurements in a time series database (TSDB).
大型的互联网服务通常能够在出现意外故障时仍能保持高可用性和响应能力。 为了提供这种服务,通常需要时刻监控和分析系统中大量数据,一种特别高效的解决方案就是使用时序数据库 (TSDB) 对这些数据进行存储和查询。
A key challenge in the design of TSDBs is how to strike the right balance between efficiency, scalability, and reliability. In this paper we introduce Gorilla, Facebook’s inmemory TSDB. Our insight is that users of monitoring systems do not place much emphasis on individual data points but rather on aggregate analysis, and recent data points are of much higher value than older points to quickly detect and diagnose the root cause of an ongoing problem. Gorilla optimizes for remaining highly available for writes and reads, even in the face of failures, at the expense of possibly dropping small amounts of data on the write path. To improve query efficiency, we aggressively leverage compression techniques such as delta-of-delta timestamps and XOR’d floating point values to reduce Gorilla’s storage footprint by 10x.
时序数据库(TSDB)设计中的一个关键挑战是如何权衡效率、可扩展性以及可靠性。 在本文中,我们介绍了一款 Facebook 的内存型时序数据库(TSDB) - Gorilla。 我们认为对监控系统来说,相比于某一个数据点,用户更加重视于数据的聚合分析,并且在快速检测和诊断一个正在发生的问题时,新数据的价值通常会远远大于老数据。Gorilla 针对于高可用的读写进行了一些优化,当出现故障时可以通过牺牲少量的写数据来保障服务的整体可用性。为了提高查询效率,我们专门使用了一些压缩技术,例如使用 Delta-Of-Delta 来编码时间戳,使用 XOR 来编码浮点值,通过这种方式,我们将 Gorilla 的存储空间减少 10 倍左右。
This allows us to store Gorilla’s data in memory, reducing query latency by 73x and improving query throughput by 14x when compared to a traditional database (HBase) backed time series data. This performance improvement has unlocked new monitoring and debugging tools, such as time series correlation search and more dense visualization tools. Gorilla also gracefully handles failures from a single-node to entire regions with little to no operational overhead.
这使得我们能够将 Gorilla 的数据存储在内存中,相比于传统的时序数据库(HBase),查询延迟减少了 73 倍,查询吞吐量提高了 14 倍。 性能的提升解锁了新的监控和调试工具,例如时间序列关联搜索,更密集的可视化工具。 Gorilla 还可以优雅地应对单个节点到整个区域的故障,并且不会有额外的运维开销。
1、介绍
Large-scale internet services aim to remain highly-available and responsive for their users even in the presence of unexpected failures. As these services have grown to support a global audience, they have scaled beyond a few systems running on hundreds of machines to thousands of individual systems running on many thousands of machines, often across multiple geo-replicated datacenters.
大型的互联网服务的目标是保持高可用,即使在故障的情况下也应该能够响应用户的请求。随着服务的发展,为了支持庞大的全球客户,需要将之前在数百台机器上运行的几个系统扩展到在数千台机器上运行的数千个单独的系统,它们通常还要跨越不同地域的数据中心。
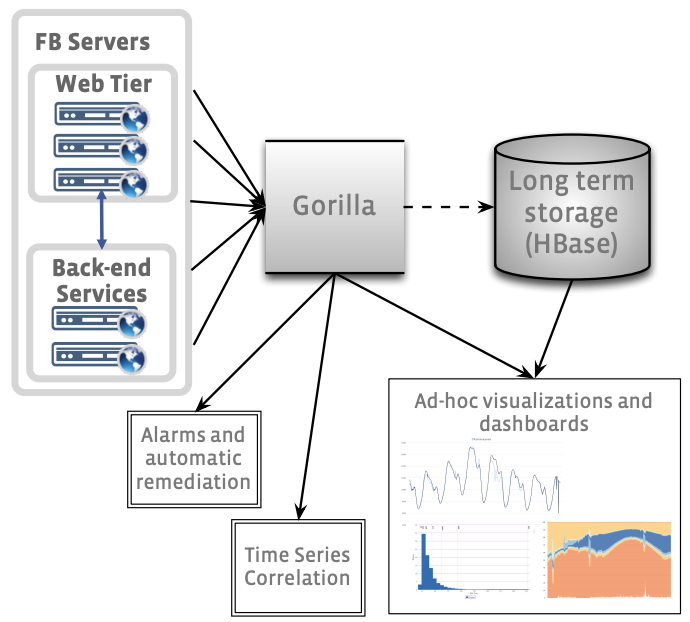
Figure 1: High level overview of the ODS monitoring and alerting system, showing Gorilla as a writethrough cache of the most recent 26 hours of time series data.
图 1:ODS 监控和警报系统的高级概述(预览),展示了 Gorilla 作为直写缓存(五种缓存策略中的其中一种)的最近 26 小时的时序数据。
An important requirement to operating these large scale services is to accurately monitor the health and performance of the underlying system and quickly identify and diagnose problems as they arise. Facebook uses a time series database (TSDB) to store system measuring data points and provides quick query functionalities on top. We next specify some of the constraints that we need to satisy for monitoring and operating Facebook and then describe Gorilla, our new inmemory TSDB that can store tens of millions of datapoints (e.g., CPU load, error rate, latency etc.) every second and respond queries over this data within milliseconds.
操作这些大型服务的一个重要需求就是要能够准确的监控底层系统的运行状况和性能,并在出现问题时能够快速的识别和诊断。 Facebook 使用时序数据库 (TSDB) 来存储系统的测量数据,并在上层提供了快速查询的功能。 后来我们在监控和运维 Facebook 时遇到了一些限制(约束),于是我们设计了 Gorilla,这是一个新的内存型时序数据库(TSDB),它每秒可以存储数千万个数据点(例如,CPU 负载、错误率、延迟等),并且能够实现毫秒级的数据查询。
Writes dominate. Our primary requirement for a TSDB is that it should always be available to take writes. As we have hundreds of systems exposing multiple data items, the write rate might easily exceed tens of millions of data points each second. In constrast, the read rate is usually a couple orders of magnitude lower as it is primarily from automated systems watching ’important’ time series, data visualization systems presenting dashboards for human consumption, or from human operators wishing to diagnose an observed problem.
大量(主导地位)的写入。 我们对于时序数据库(TSDB)的主要需求是它应该始终可以接受写操作。由于我们有数百个暴露了众多的数据项的系统,因此可能很容易就会超过每秒数千万的写入速率。 相比之下,读取的速率通常要低好几个数量级,读取主要来自于观测 “重要” 时序数据的自动化系统,供人使用的数据可视化仪表盘,诊断线上问题时的人为操作。
State transitions. We wish to identify issues that emerge from a new software release, an unexpected side effect of a configuration change, a network cut and other issues that result in a significant state transition. Thus, we wish for our TSDB to support fine-grained aggregations over short-time windows. The ability to display state transitions within tens of seconds is particularly prized as it allows automation to quickly remediate problems before they become wide spread.
状态转换。 我们希望找出新软件发布中出现的问题,配置更改导致的副作用,网络中断 和 其他导致重大的状态转变的问题。 因此,我们希望我们的时序数据库 (TSDB) 能够支持在很短的时间窗口内实现细粒度的聚合计算。这种在几十秒内能够迅速检测到系统状态发生变化的能力是非常有价值的,因为(基于)它就可以在故障扩散之前进行自动化的修复。
High availability. Even if a network partition or other failure leads to disconnection between different datacenters, systems operating within any given datacenter ought to be able to write data to local TSDB machines and be able to retrieve this data on demand.
高可用性。 即使网络分区或其他故障导致不同数据中心之间断开连接,任何数据中心都应该能够将数据写入本地的时序数据库(TSDB)机器中,并能够按需查询这些数据。
Fault tolerance. We wish to replicate all writes to multiple regions so we can survive the loss of any given datacenter or geographic region due to a disaster.
容错。 我们希望将所有的写操作复制到多个区域中,这样我们就可以容忍任何数据中心或不同地域的节点发生故障(灾难)。
Gorilla is Facebook’s new TSDB that satisfies these constraints. Gorilla functions as a write-through cache of the most recent data entering the monitoring system. We aim to ensure that most queries run within 10’s of milliseconds.
Gorilla 是 Facebook 研发的新型时序数据库 (TSDB),它满足了这些约束(限制)。 Gorilla 使用直写缓存(Write-Through Cache)的方式来记录写入监控系统的最新数据。 我们的目标是确保大多数查询在 10 毫秒内完成。
The insight in Gorilla’s design is that users of monitoring systems do not place much emphasis on individual data points but rather on aggregate analysis. Additionally, these systems do not store any user data so traditional ACID guarantees are not a core requirement for TSDBs. However, a high percentage of writes must succeed at all times, even in the face of disasters that might render entire datacenters unreachable. Additionally, recent data points are of higher value than older points given the intuition that knowing if a particular system or service is broken right now is more valuable to an operations engineer than knowing if it was broken an hour ago. Gorilla optimizes for remaining highly available for writes and reads, even in the face of failures, at the expense of possibly dropping small amounts of data on the write path.
Gorilla 独特的设计点在于,用户在使用监控系统时通常不会重视单独的一个数据点,而是更在意整体的数据聚合分析。此外,这些系统不会存储任何用户数据,因此传统的 ACID 特性并不是时序数据库(TSDB) 的核心需求。但是,即使在面对可能导致整个数据中心都无法访问的灾难时,大部分的写操作也必须始终执行成功。此外,最近的数据点要比旧的数据点更有价值,通常对于运维工程师来说,了解一个特定的系统或者服务现在是否存在故障比知道之前它一个小时前是否存在故障更有价值。Gorilla 对于读写的可用性也做了一些优化,即使在出现故障时,也只会在仅仅丢失少量的数据的同时来保证整体的可用性。
The challenge then arises from high data insertion rate, total data quantity, real-time aggregation, and reliability requirements. We addressed each of these in turn. To address the first couple requirements, we analyzed the Operational Data Store (ODS) TSDB, an older monitoring system that was widely used at Facebook. We noticed that at least 85% of all queries to ODS was for data collected in the past 26 hours. Further analysis allowed us to determine that we might be able to serve our users best if we could replace a disk-based database with an in-memory database. Further, by treating this in-memory database as a cache of the persistent disk-based store, we could achieve the insertion speed of an in-memory system with the persistence of a disk based database.
挑战主要来自于高性能的写入、数据总量、实时聚合和可靠性的要求。我们依次地解决了这些问题。为了解决前两个需求,我们分析了操作数据存储 (ODS)时序数据库(TSDB),这是一个在 Facebook 上广泛使用的比较老的监控系统。我们注意到,对 ODS 的所有查询中,至少有 85% 的查询是访问过去 26 小时内收集的数据。进一步的分析使我们能够确定,如果我们能够用一个内存数据库代替基于磁盘的数据库,我们也许能够为用户提供最好的服务。此外,通过将这个内存数据库视为基于磁盘的持久存储的缓存,我们可以在基于磁盘的数据库持久存储的情况下实现内存系统的插入速度。
As of Spring 2015, Facebook’s monitoring systems generate more than 2 billion unique time series of counters, with about 12 million data points added per second. This represents over 1 trillion points per day. At 16 bytes per point, the resulting 16TB of RAM would be too resource intensive for practical deployment. We addressed this by repurposing an existing XOR based floating point compression scheme to work in a streaming manner that allows us to compress time series to an average of 1.37 bytes per point, a 12x reduction in size.
截至到 2015 年春季,Facebook 的监控系统产生了超过 20 亿个唯一的时间序列计数器,每秒增加大约1200万个数据点。这意味着每天会增加超过 1 万亿个数据点。假设每个数据点占用 16字节,每天就需要 16TB 的内存空间,这对于实际的部署而言是巨大的资源消耗。我们通过重用现有的基于异或(XOR)的浮点数压缩方案来解决这个问题,该方案以流的方式工作,允许我们将时间序列压缩到平均每个点 1.37 字节,大小减少了 12 倍。
We addressed the reliability requirements by running multiple instances of Gorilla in different datacenter regions and streaming data to each without attempting to guarantee consistency. Read queries are directed at the closest available Gorilla instance. Note that this design leverages our observation that individual data points can be lost without compromising data aggregation unless there’s significant discrepancy between the Gorilla instances.
我们通过在不同的数据中心区域运行 Gorilla 的多个实例并向每个实例传输数据来满足可靠性需求,但不会试图去保证一致性。读查询会直接路由到最近的可用 Gorilla 实例上。请注意,这种设计基于我们的所见所闻,即单个数据点的丢失并不会影响数据聚合,除非 Gorilla 实例之间存在显著差异。
Gorilla is currently running in production at Facebook and is used daily by engineers for real-time firefighting and debugging in conjunction with other monitoring and analysis systems like Hive [27] and Scuba [3] to detect and diagnose problems.
Gorilla 目前部署在 Facebook 的生产环境中,工程师们把它当做日常的实时数据工具,并协同其它监控和分析系统(例如Hive、Scuba)一起检测和诊断问题。
2、背景和要求
2.1、操作数据存储(ODS)
Operating and managing Facebook’s large infrastructure comprised of hundreds of systems distributed across multiple data centers would be very difficult without a monitoring system that can track their health and performance. The Operational Data Store (ODS) is an important portion of the monitoring system at Facebook. ODS comprises of a time series database (TSDB), a query service, and a detection and alerting system. ODS’s TSDB is built atop the HBase storage system as described in [26]. Figure 1 represents a high-level view of how ODS is organized. Time series data from services running on Facebook hosts is collected by the ODS write service and written to HBase.
如果没有可以跟踪其健康状况和性能的监控系统,运营和管理分布在多个数据中心的数百个系统的 Facebook 大型基础设施将会变得非常困难。操作数据存储(ODS)是 Facebook 监控系统的重要组成部分。ODS 由时间序列数据库 (TSDB)、查询服务和检测警报系统组成。 ODS 的 TSDB 构建在 HBase 存储系统之上,如 [26] 中所述。 图 1 展示了 ODS 组织方式的高级视图。 来自 Facebook 主机上运行的服务的时间序列数据由 ODS 写入服务收集并写入 HBase。
There are two consumers of ODS time series data. The first consumers are engineers who rely on a charting system that generates graphs and other visual representations of time series data from ODS for interactive analysis. The second consumer is our automated alerting system that read counters off ODS, compares them to preset thresholds for health, performance and diagnostic metrics and fires alarms to oncall engineers and automated remediation systems.
ODS 时间序列数据有两个消费者。 第一个消费者是工程师,他们依赖图表系统从 ODS 生成图形和其他时间序列数据的可视化表示,以便于进行交互式分析。 第二个消费者是我们的自动警报系统,它可以读取 ODS 的计数器,将它们与预设的健康、性能和诊断指标阈值进行比较,并向值班(oncall)工程师和自动修复系统发出警报。
2.1.1、监控系统读取性能问题
In early 2013, Facebook’s monitoring team realized that its HBase time series storage system couldn’t scale handle future read loads. While the average read latency was acceptable for interactive charts, the 90th percentile query time had increased to multiple seconds blocking our automation. Additionally, users were self-censoring their usage as interactive analysis of even medium-sized queries of a few thousand time series took tens of seconds to execute. Larger queries executing over sparse datasets would timeout as the HBase data store was tuned to prioritize writes. While our HBase-based TSDB was inefficient, we quickly rejected wholesale replacement of the storage system as ODS’s HBase store held about 2 PB of data [5]. Facebook’s data warehouse solution, Hive, was also unsuitable due to its already orders of magnitude higher query latency comparing to ODS, and query latency and efficiency were our main concerns [27].
2013 年初,Facebook 的监控团队意识到其 HBase 时间序列存储系统无法进行扩展来支撑未来的读取负载。 虽然交互式图表的平均读取延迟是可以接受的,但 90% 的查询时间已经到达到数秒,这阻碍了我们的自动化。 此外,用户对自己的使用情况会进行自我审查,即使是对几千个时间序列的中型查询的交互式分析也需要数十秒才能执行完成。 由于 HBase 数据存储已调整为写优先,在稀疏数据集上执行的较大查询将超时。虽然我们基于 HBase 的 TSDB 效率低下,但我们很快就拒绝了存储系统的大规模更换,因为 ODS 的 HBase 存储拥有大约 2 PB 的数据 [5]。 Facebook 的数据仓库解决方案 Hive 也不适合,因为它的查询延迟比 ODS 高出了几个数量级,而查询延迟和效率又是我们主要关心的问题 [27]。
We next turned our attention to in-memory caching. ODS already used a simple read-through cache but it was primarily targeted at charting systems where multiple dashboards shared the same time series. A particularly difficult scenario was when dashboards queried for the most recent data point, missed in the cache, and then issued requests directly to the HBase data store. We also considered a separate Memcache [20] based write-through cache but rejected it as appending new data to an existing time series would require a read/write cycle, causing extremely high traffic to the memcache server. We needed a more efficient solution.
接下来我们将注意力转向了内存缓存。 ODS 已经使用了一个简单的直读缓存,但它主要针对多个仪表板共享相同时间序列的图表系统。 一个特别困难的场景是当仪表板查询最近的数据点时,如果缓存中不存在,它将直接向 HBase 数据存储发出请求。 我们还考虑了一个单独的基于 Memcache [20] 的直写缓存,但最后被否决了,因为将新数据追加到现有的时间序列将需要一个读/写周期,从而导致 Memcache 服务器的流量非常大。 我们需要一个更有效的解决方案。
2.2、Gorilla的需求
With these considerations, we determined the following requirements for a new service:
考虑到这些因素,我们确定了新服务的以下要求(需要满足):
- 2 billion unique time series identified by a string key.
- 700 million data points (time stamp and value) added per minute.
- Store data for 26 hours.
- More than 40,000 queries per second at peak.
- Reads succeed in under one millisecond.
- Support time series with 15 second granularity (4 points per minute per time series).
- Two in-memory, not co-located replicas (for disaster recovery capacity).
- Always serve reads even when a single server crashes.
- Ability to quickly scan over all in memory data.
- Support at least 2x growth per year.
- 20 亿个由字符串键标识的唯一时间序列;
- 每分钟添加 7 亿个数据点(时间戳和值);
- 存储数据 26 小时;
- 峰值时每秒超过 40,000 个查询;
- 在一毫秒内读取成功;
- 支持 15 秒粒度的时间序列(每个时间序列每分钟 4 个点);
- 两个内存中的非共存副本(用于灾难恢复能力);
- 即使单个服务器崩溃,也始终提供读取服务;
- 能够快速扫描所有内存数据;
- 支持每年至少 2 倍的增长;
After a brief comparison with other TSDB systems in Section 3, we detail the implementation of Gorilla in Section 4, first discussing its new time stamp and data value compression schemes in Section 4.1. We then describe how Gorilla remains highly available despite single node failures and region-wide disasters in Section 4.4. We describe how Gorilla has enabled new tools in Section 5. We close out by describing our experience developing and deploying Gorilla in Section 6.
在第 3 节与其他 TSDB 系统进行了简要比较之后,我们在第 4 节详细介绍了 Gorilla 的实现,首先在第 4.1 节讨论了其新的时间戳和数据值压缩方案。 然后,我们将在 4.4 节中描述 Gorilla 如何在单节点故障和区域范围内发生灾难的情况下保持高可用性。 我们将在第 5 节中描述 Gorilla 如何启用新工具。最后我们在第 6 节中描述我们开发和部署 Gorilla 的经验。
3、与 TSDB 系统的比较
There are a number of publications detailing data mining techniques to search, classify, and cluster enormous amounts of time series data efficiently [8, 23, 24]. These systems demonstrate many of the uses of examining time series data, from clustering and classifying [8, 23] to anomaly detection [10, 16] to indexing the time series [9, 12, 24]. However, there are fewer examples detailing systems able to gather and store massive amounts of time series data in real-time. Gorilla’s design, focusing on reliable real-time monitoring of production systems, makes stand out compared to other TSDBs. Gorilla occupies an interesting design space, where being available for reads and writes in the face of failures prioritized over availability of any older data.
有很多出版物详细介绍了通过数据挖掘技术来进行搜索、分类和高效聚合大量的时间序列数据 [8, 23, 24]。这些系统描述了研究时间序列数据的许多用途,从聚类和分类 [8, 23] 到异常检测 [10, 16] 到索引时间序列 [9, 12, 24]。但是,很少有能够进行实时收集和存储大量时间序列数据的系统的详细示例。 Gorilla 的设计专注于对生产系统进行可靠的实时监控,在与其他 TSDB 的比较中脱颖而出。Gorilla 有一个有趣的设计:当出现故障时仍然可以进行读取和写入,该优先级高于任何旧数据的可用性。
Since Gorilla was designed from the beginning to store all data in memory, its in-memory structure is also different from existing TSDBs. However, if one views Gorilla as an intermediate store for in-memory storage of time series data in front of another on-disk TSDB, then Gorilla could be used as a write through cache for any TSDB (with relatively simple modifications). Gorilla’s focus on speed of ingest and horizontal scaling is similar to existing solutions.
由于 Gorilla 从一开始的设计初衷就是将数据存储在内存中,因此它的内存结构不同于现有的 TSDB。 但是,如果将 Gorilla 看作一个中间存储,用来在基于磁盘的 TSDB 的上层的内存中存储时间序列数据,那么 Gorilla 可以通过相对简单的修改来用作任何 TSDB 的直写缓存(Write-Through Cache)。Gorilla 对摄取速度和水平扩展的关注与现有解决的方案类似。
3.1、OpenTSDB
OpenTSDB is based on HBase [28], and very closely resembles the ODS HBase storage layer we use for long term data. Both systems rely on similar table structures, and have come to similar conclusions for optimization and horizontal scalability [26, 28]. However, we had found that supporting the volume of queries necessary to build advanced monitoring tools required faster queries than a disk based store can support.
OpenTSDB 基于 HBase [28],它和用于存储长期数据的 ODS HBase 存储层非常相似。 两个系统都拥有相似的表结构,并且在优化和水平扩展性方面都有着相似的结论 [26, 28]。 但是,我们发现为了支持构建高级监控工具的大量查询,我们需要比基于磁盘的存储所能支持的更快的查询。
Unlike OpenTSDB, the ODS HBase layer does do time roll up aggregation for older data to save space. This results in older, archived data having lower time granularity compared to more recent data in ODS, while OpenTSDB will keep the full resolution data forever. We have found that cheaper long time period queries and space savings are worth the loss of precision.
不同于 OpenTSDB ,ODS HBase 存储层会定期的对老数据进行聚合以节省空间。这导致 ODS 中的老数据相比于新数据的时间间隔粒度更大,而 OpenTSDB 永远保留完整分辨率的数据。 我们发现从成本较低的长时间片查询以及空间的节省上来说,数据精度的丢失是可以接受的。
OpenTSDB also has a richer data model for identifying time series. Each time series is identified by a set of arbitrary key-value pairs, called tags [28]. Gorilla identifies time series with a single string key and relies on higher level tools to extract and identify time series meta data.
OpenTSDB 还有更丰富的数据模型来识别时间序列。 每个时间序列由一组任意键值对标识,称为标签 [28]。 Gorilla 使用单个字符串键识别时间序列,并依赖更高级别的工具来提取和识别时间序列元数据。
3.2、Whisper (Graphite)
Graphite stores time series data on local disk in the Whisper format, a Round Robin Database (RRD) style database [1]. This file format expects time series data to be timestamped at regular intervals, and does not support jitter in the time series. While Gorilla does work more efficiently if data are timestamped at regular intervals, it can handle arbitrary and changing intervals. With Whisper, each time series is stored in a separate file, and new samples overwrite old ones after a certain amount of time [1]. Gorilla works in a similar fashion, only holding the most recent day of data in memory. However, with its focus on on-disk storage, query latency using Graphite/Whisper is not fast enough to match the requirements for Gorilla.
Graphite 将时间序列数据以 Whisper 格式存储在本地磁盘上,这是一种循环数据库 (RRD) 风格的数据库 [1]。 这种文件格式要求时间序列数据是按照固定的时间间隔产生的,不支持间隔跳动的时间序列。 如果数据时间戳的时间间隔固定,Gorilla 确实可以更有效地工作,但它也支持处理任意和不断变化的时间间隔。 使用 Whisper,每个时间序列都存储在一个单独的文件中,并且新样本数据会在一定时间后覆盖旧样本数据 [1]。 Gorilla 以类似的方式工作,只在内存中保存最近一天的数据。 然而,由于 Graphite/Whisper 专注于磁盘存储,因此它的查询延迟无法满足 Gorilla 的要求。
3.3、InfluxDB
InfluxDB is a new open-source time series database, with an even richer data model than OpenTSDB. Each event in a time series can have a full set of meta data. While this flexibility does allow for rich data, it necessarily results in larger disk usage than schemes that only store time series within the database [2].
InfluxDB 是一个全新的开源时序数据库,其数据模型比 OpenTSDB 更加丰富。 时间序列中的每个事件都可以拥有一整套元数据。 虽然这种灵活性允许其使用丰富的数据,但是相比于仅在数据库中存储时间序列的方案来说,它必然会导致更大的磁盘使用量 [2]。
InfluxDB also contains the code to build it as a distributed storage cluster, allowing users to scale horizontally without the overhead of managing an HBase/Hadoop cluster [2]. At Facebook, we already have dedicated teams to support our HBase installations, so using it for ODS did not involve a large extra investment in resources. Like other systems, InfluxDB keeps data on-disk, leading to slower queries than if data are kept in memory.
InfluxDB 还包含一些支持构建为分布式存储集群的代码,它允许用户水平扩展而无需管理 HBase/Hadoop 集群 [2]。 在 Facebook,我们已经有专门的团队来支持 HBase 的安装,因此将其用于 ODS 并不需要大量额外的资源投资。 与其他系统一样,InfluxDB 将数据保存在磁盘上,导致查询速度相比将数据保存在内存中要慢。
4、Gorilla架构
Gorilla is an in-memory TSDB that functions as a writethrough cache for monitoring data written to an HBase data store. The monitoring data stored in Gorilla is a simple 3- tuple of a string key, a 64 bit time stamp integer and a double precision floating point value. Gorilla incorporates a new time series compression algorithm that allows us to compress each by series down from 16 bytes to an average of 1.37 bytes, a 12x reduction in size. Further, we have arranged Gorilla’s in-memory data structures to allow fast and efficient scans of all data while maintaining constant time lookup of individual time series.
Gorilla 是一个基于内存的 TSDB,在监控数据写入 HBase 数据存储时,起到直写缓存(Write-Through Cache)的作用。 Gorilla 中存储的监控数据是一个简单的三元组:字符串键、64 位时间戳整数和双精度浮点值。 Gorilla 采用了一种新的时间序列压缩算法,允许我们将每个序列从 16 个字节压缩到平均 1.37 个字节,大小减少了 12 倍。 此外,我们设计了 Gorilla 的内存数据结构,在保持对单个时间序列查找时间恒定的同时,也能够快速高效的进行全数据扫描。
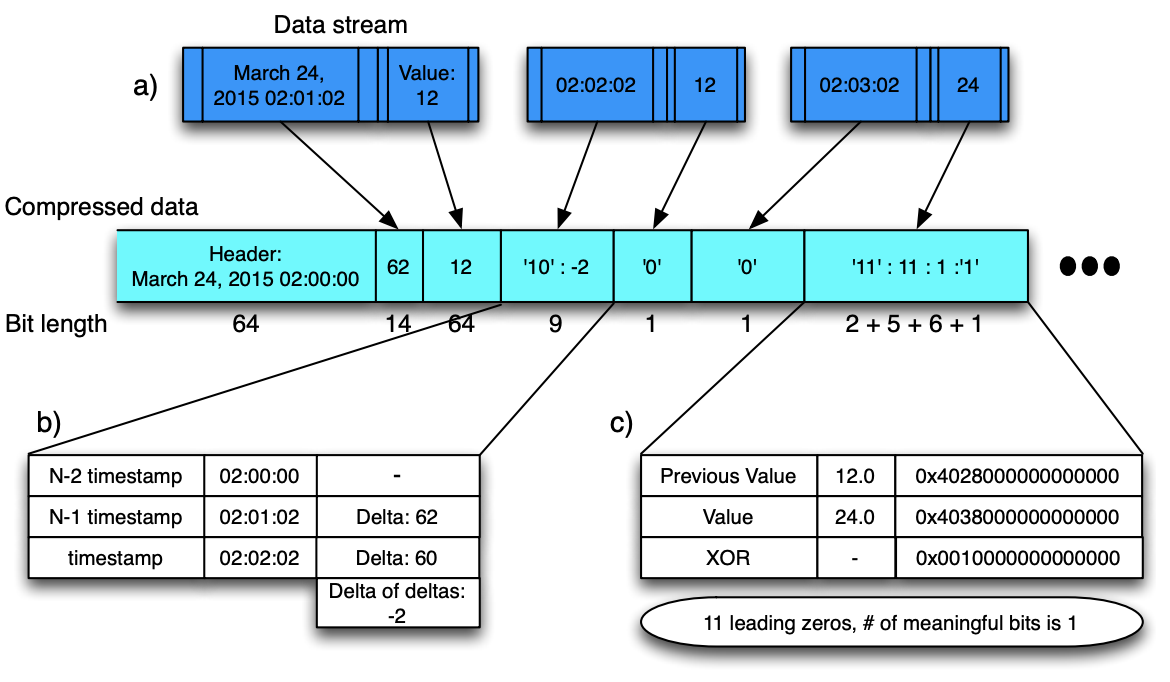
Figure 2: Visualizing the entire compression algorithm. For this example, 48 bytes of values and time stamps
are compressed to just under 21 bytes/167 bits.
图 2:可视化整个压缩算法。 对于此示例,48 字节的值和时间戳被压缩到略低于 21 字节(大约167 位)。
The key specified in the monitoring data is used to uniquely identify a time series. By sharding all monitoring data based on these unique string keys, each time series dataset can be mapped to a single Gorilla host. Thus, we can scale Gorilla by simply adding new hosts and tuning the sharding function to map new time series data to the expanded set of hosts. When Gorilla was launched to production 18 months ago, our dataset of all time series data inserted in the past 26 hours fit into 1.3TB of RAM evenly distributed across 20 machines. Since then, we have had to double the size of the clusters twice due to data growth, and are now running on 80 machines within each Gorilla cluster. This process was simple due to the share-nothing architecture and focus on horizontal scalability.
监控数据中指定的键用于唯一标识一个时间序列。 通过使用这些唯一的字符串键来对所有的监控数据进行分片,每个时间序列数据集都可以映射到单个 Gorilla 主机。因此,我们可以通过简单地添加新主机并调整分片算法来将新的时间序列数据映射到新的主机上,从而实现扩展 Gorilla 的目的。 当 Gorilla 在 18 个月前投入生产时,我们在过去 26 小时内插入的所有时间序列数据的数据集均匀分布在 20 台机器上的 1.3TB 内存中。 在那之后,由于数据的增长,我们不得不将集群规模翻倍,现在每个 Gorilla 集群运行在 80 台机器上。 由于无共享(Share-Nothing)架构和专注于水平的可扩展性,这个扩展的过程相当简单。
Gorilla tolerates single node failures, network cuts, and entire datacenter failures by writing each time series value to two hosts in separate geographic regions. On detecting a failure, all read queries are failed over to the alternate region ensuring that users do not experience any disruption.
Gorilla 通过将每个时间序列值写入不同地域的两台主机中来容忍单节点故障,网络中断,甚至于整个数据中心故障。 检测到故障时,所有读取操作都将故障转移到备用区域,确保用户不会感知任何中断。
4.1、时序压缩
In evaluating the feasibility of building an in-memory time series database, we considered several existing compression schemes to reduce the storage overhead. We identified techniques that applied solely to integer data which didn’t meet our requirement of storing double precision floating point values. Other techniques operated on a complete dataset but did not support compression over a stream of data as was stored in Gorilla [7, 13]. We also identified lossy time series approximation techniques used in data mining to make the problem set more easily fit within memory [15, 11], but Gorilla is focused on keeping the full resolution representation of data.
在评估构建内存时间序列数据库的可行性时,我们考虑了几种现有的压缩方案来降低存储开销。 我们确定了仅适用于整数数据的技术,这些技术不符合我们存储双精度浮点值的要求。 其他技术在完整数据集上运行,但不支持对存储在 Gorilla [7, 13] 中的数据流进行压缩。 我们还确定了数据挖掘中使用的有损的时间序列近似技术(Lossy Time Series Approximation Techniques),尝试使其更适合用内存来存储 [15, 11],但 Gorilla 专注于保持数据的完整性。
Our work was inspired by a compression scheme for floating point data derived in scientific computation. This scheme leveraged XOR comparison with previous values to generate a delta encoding [25, 17].
我们受到了科学计算中浮点数据压缩方案的启发。 该方案利用与先前值的 XOR 比较来生成差值编码 [25, 17]。
Gorilla compresses data points within a time series with no additional compression used across time series. Each data point is a pair of 64 bit values representing the time stamp and value at that time. Timestamps and values are compressed separately using information about previous values. The overall compression scheme is visualized in Figure 2, showing how time stamps and values are interleaved in the compressed block.
Gorilla 只对一个时间序列中的数据点进行压缩,不会有跨时间序列压缩。每个数据点是一对 64 位值,表示当时的时间戳和值。时间戳和值根据先前的值分别进行压缩。整体的压缩方案如图 2 所示,图中展示了时间戳和值是如何在压缩块中交错分布的。
Figure 2.a illustrates the time series data as a stream consisting of pairs of measurements (values) and time stamps. Gorilla compresses this data stream into blocks, partitioned by time. After a simple header with an aligned time stamp (starting at 2 am, in this example) and storing the first value in a less compressed format, Figure 2.b shows that timestamps are compressed using delta-of-delta compression, described in more detail in Section 4.1.1. As shown in Figure 2.b the time stamp delta of delta is −2. This is stored with a two bit header (‘10’), and the value is stored in seven bits, for a total size of just 9 bits. Figure 2.c shows floating-point values are compressed using XOR compression, described in more detail in Section 4.1.2. By XORing the floating point value with the previous value, we find that there is only a single meaningful bit in the XOR. This is then encoded with a two bit header (‘11’), encoding that there are eleven leading zeros, a single meaningful bit, and the actual value (‘1’). This is stored in fourteen total bits.
图 2.a 表明时间序列数据是由成对的时间戳和测量值组成的数据流。 Gorilla 按照时间分区将数据流压缩到数据块中。这里先定义了一个由基线时间构成的 Header (图例中从 2 点开始),然后将第一个值进行了简单的压缩并存储,图 2.b 显示了时间戳的压缩方式为 delta-of-delta ,这个在第 4.1.1 节由更详细的描述。如图 2.b 所示,时间戳 delta-of-delta 的值为 -2 ,我们使用 2 位来存储 Header (’10’),并且之后使用 7 位来存储该值,总大小只有 9 位。图 2.c 显示了浮点值的压缩方式为 XOR,这个在第 4.1.2 节由更详细的描述。通过将浮点值与前一个值进行异或(XOR)计算,我们发现最后只有 1 个有意义的位,然后使用 2 位来编码 Header(’11’),编码中有 11 个前导零(Leading Zero),1 个有意义的位和实际值(’1’),总大小为 14 位。
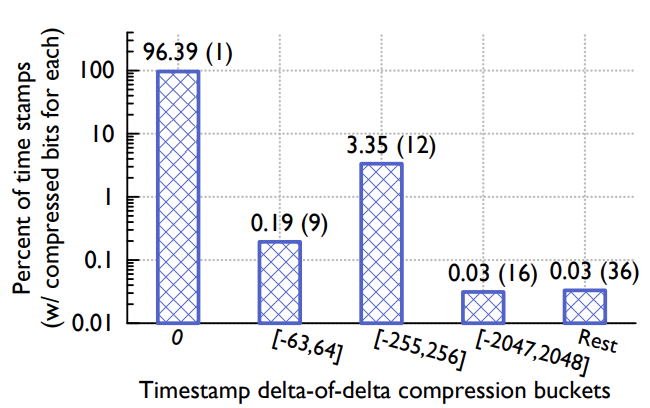
Figure 3: Distribution of time stamp compression across different ranged buckets. Taken from a sample of 440, 000 real time stamps in Gorilla.
图 3:不同范围存储桶的时间戳压缩分布。 来自于 Gorilla 中 440, 000 个实时时间戳的样本数据。
4.1.1、 时间戳压缩
We analyzed the time series data stored in ODS so we could optimize the compression scheme implemented in Gorilla. We noticed that the vast majority of ODS data points arrived at a fixed interval. For instance, it is common for a time series to log a single point every 60 seconds. Occasionally, the point may have a time stamp that is 1 second early or late, but the window is usually constrained.
我们分析了 ODS 中存储的时间序列数据,因此我们尝试优化 Gorilla 中实现的数据压缩方案。我们观察到绝大部分的 ODS 数据的时间间隔都是固定的。例如,时间序列通常每 60 秒记录一个点,有时这个点可能会提前或者推迟 1 秒,但是时间窗口通常都是固定的。
Rather than storing timestamps in their entirety, we store an efficient delta of deltas. If the delta between time stamps for subsequent data points in a time series are 60, 60, 59 and 61 respectively, the delta of deltas is computed by subtracting the current time stamp value from the previous one which gives us 0, -1 and 2. An example of how this works is shown in Figure 2.
我们不是存储完整的时间戳,而是存储一个有效的差值的差值( delta of deltas )。 如果时间序列中后续数据点的时间戳之间的 delta 分别为 60、60、59 和 61,则 delta 的 delta 是通过从前一个时间戳值中减去当前时间戳值来计算的,得到 0、-1 和 2 . 图 2 展示了其工作原理的一个示例。
We next encode the delta of deltas using variable length encoding with the following algorithm:
接下来,我们使用以下算法使用可变长度编码对 差值的差值(delta of delta) 进行编码:
- The block header stores the starting time stamp, t−1, which is aligned to a two hour window; the first time stamp, t0, in the block is stored as a delta from t−1 in 14 bits.
- For subsequent time stamps, tn:
- Calculate the delta of delta: D = (tn − t(n−1)) − (t(n−1) − t(n−2))
- If D is zero, then store a single ‘0’ bit
- If D is between [-63, 64], store ‘10’ followed by the value (7 bits)
- If D is between [-255, 256], store ‘110’ followed by the value (9 bits)
- If D is between [-2047, 2048], store ‘1110’ followed by the value (12 bits)
- Otherwise store ‘1111’ followed by D using 32 bits
- 数据块的头部存储起始时间戳( t-1 ),对齐窗口为 2 小时;数据块中的第一个时间戳( t0 )存储为 14 位中( t-1 )的增量。
- 对于后续的时间戳( tn ):
- 计算差值的差值:D = (tn − t(n−1)) − (t(n−1) − t(n−2)) ;
- 如果 D 为 0 ,则使用 1 个比特位来存储 ‘0’ ;
- 如果 D 的范围位于 [-63, 64] ,则先使用 2 个比特位存储 ‘10’ ,然后再使用 7 个比特位存储 D 值;
- 如果 D 的范围位于 [-255, 256] ,则先使用 3 个比特位存储 ‘110’ ,然后再使用 9 个比特位存储 D 值;
- 如果 D 的范围位于 [-2047, 2048] ,则先使用 4 个比特位存储 ‘1110’ ,然后再使用 12 个比特位存储 D 值;
- 其他情况下,则先使用 4 个比特位存储 ‘1111’ ,然后再使用 32 个比特位存储 D 值;
The limits for the different ranges were selected by sampling a set of real time series from the production system and selecting the ones that gave the best compression ratio. A time series might have data points missing but the existing points likely arrived at fixed intervals. For example if there’s one missing data point the deltas could be 60, 60, 121 and 59. The deltas of deltas would be 0, 61 and -62. Both 61 and -62 fit inside the smallest range and fewer bits can be used to encode these values. The next smallest range [-255, 256] is useful because a lot of the data points come in every 4 minutes and a single data point missing still uses that range.
这些不同的取值范围是从真实的生产环境的时间序列中采样出来的,每个值都能选择合适的范围以达到最好的压缩比。一个时间序列可能会丢失部分数据点,但是它现存的数据很可能都是以固定的时间间隔产生的。例如,如果缺少了一个数据点,则增量可能是 60,60,121,59,那么差值的差值( delta of deltas )将是 0,61 和 -62。其中 61 和 -62 都处于最小的的范围内,并且可以使用较小的位来编码这些值。下一个编码取值范围 [-255, 256] 也很有用,因为还有很多数据点是每 4 分钟出现一次,当缺少了单个数据点时仍然可以使用这个取值范围。
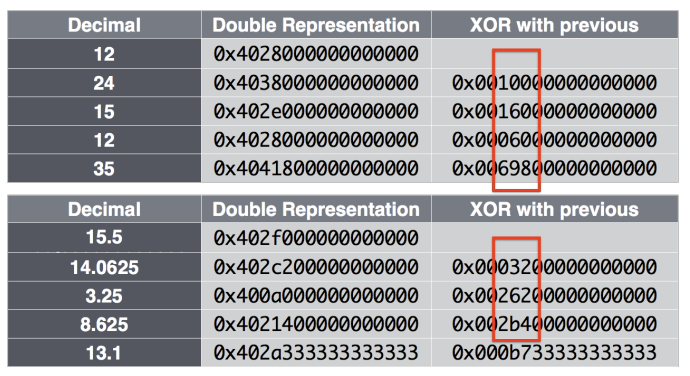
Figure 4: Visualizing how XOR with the previous value often has leading and trailing zeros, and for many series, non-zero elements are clustered.
图 4:展示了与前一个值的 XOR 通常如何具有前导零和尾随零,并且对于许多时间序列,非零元素通常是聚集在一起的。
Figure 3 show the results of time stamp compression in Gorilla. We have found that about 96% of all time stamps can be compressed to a single bit.
图 3 显示了 Gorilla 中时间戳压缩的结果。 我们发现大约 96% 的时间戳可以压缩到一个位。
4.1.2、值压缩
In addition to the time stamp compression, Gorilla also compresses data values. Gorilla restricts the value element in its tuple to a double floating point type. We use a compression scheme similar to existing floating point compression algorithms, like the ones described in [17] and [25].
除了压缩时间戳,Gorilla 还会压缩数据值。 Gorilla 将其元组中的数据值限制为双浮点类型。 我们使用类似于现有浮点压缩算法的压缩方案,类似于 [17] 和 [25] 中描述的那些。
From analyzing our ODS data, we discovered that the value in most time series does not change significantly when compared to its neighboring data points. Further, many data sources only store integers into ODS. This allowed us to tune the expensive prediction scheme in [25] to a simpler implementation that merely compares the current value to the previous value. If values are close together the sign, exponent, and first few bits of the mantissa will be identical. We leverage this to compute a simple XOR of the current and previous values rather than employing a delta encoding scheme.
通过分析 ODS 的数据,我们发现大多数时间序列中的值与其相邻数据点的值相比没有显著的变化。 此外,许多数据源只会将整数存储到 ODS 中。 这使我们可以将文末参考文献 [25] 中的复杂方案调整为更简单的实现,该实现仅将当前值与先前值进行比较。 如果值接近,那么尾数的符号、指数和前几位将完全相同。 因此对当前值和前一个值做一个简单的异或(XOR)运算,而不是像时间戳那样采用差值编码方案。
We then encode these XOR’d values with the following variable length encoding scheme:
我们用下面的规则对异或(XOR)后的值进行可变长编码:
- The first value is stored with no compression
- If XOR with the previous is zero (same value), store single ‘0’ bit
- When XOR is non-zero, calculate the number of leading and trailing zeros in the XOR, store bit ‘1’ followed by either a) or b):
- (Control bit ‘0’) If the block of meaningful bits falls within the block of previous meaningful bits, i.e., there are at least as many leading zeros and as many trailing zeros as with the previous value use that information for the block position and just store the meaningful XORed value.
- (Control bit ‘1’) Store the length of the number of leading zeros in the next 5 bits, then store the length of the meaningful XORed value in the next 6 bits. Finally store the meaningful bits of the XORed value.
- 第一个值不进行压缩存储;
- 如果与前一个值的异或(XOR)结果为零(相同值),则使用 1 个比特位存储 ‘0’ ;
- 当 XOR 不为零时,计算 XOR 中前导零和尾随零的数量,则使用 1 个比特位存储 ‘1’ ,接下来的值为下面两种之一:
- (控制位 ‘0’ )如果有意义的位(即中间非 0 部分)的数据块被前一个数据块包含,即,至少有与先前值一样多的前导零和尾随零,那么就可以直接在数据块中使用这些信息,并且仅需要存储非 0 的 XOR 值;
- (控制位 ‘1’ )将前导零数量的长度存储在接下来的 5 位中,然后将有意义的 XOR 值的长度存储在接下来的 6 位中。 最后存储 XOR 值的有意义的位;
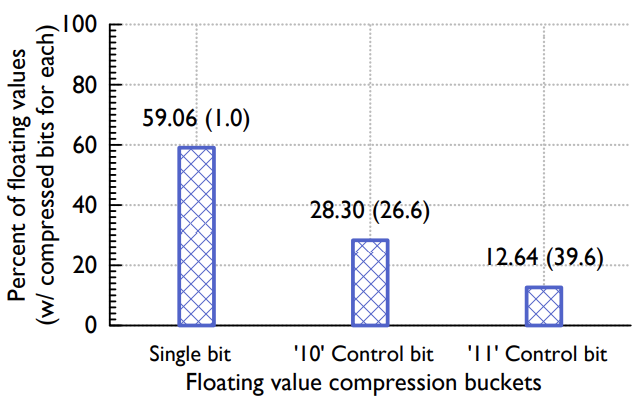
Figure 5: Distribution of values compressed across different XOR buckets. Taken from a sample of 1.6 million real values in Gorilla.
图 5:不同 XOR 存储桶压缩的值分布。 取自 Gorilla 中 160 万个真实值的样本。
The overall compression scheme is visualized in Figure 2 which depicts how our XOR encoding can store the values in a time series efficiently.
整体压缩方案如图 2 所示,它描述了我们的 XOR 编码如何有效地将值存储在时间序列中。
Figure 5 shows the distribution of actual values in Gorilla. Roughly 51% of all values are compressed to a single bit since the current and previous values are identical. About 30% of the values are compressed with the control bits ‘10’ (case b), with an average compressed size of 26.6 bits. The remaining 19% are compressed with control bits ‘11’, with an average size of 36.9 bits, due to the extra 13 bits of overhead required to encode the length of leading zero bits and meaningful bits.
图 5 显示了 Gorilla 中实际值的分布。 由于当前值和以前的值相同,因此大约 51% 的值被压缩后仅使用 1 个比特位。 大约 30% 的值使用控制位 ‘10’(情况 b)进行压缩,平均压缩大小为 26.6 位。 剩余的 19% 使用控制位 ‘11’ 进行压缩,平均大小为 36.9 位,位数多是因为编码前导零位和有意义位的长度需要额外的 13 位开销。
This compression algorithm uses both the previous floating point value and the previous XORed value. This results in an additional compression factor because a sequence of XORed values often have a very similar number of leading and trailing zeros, as visualized in Figure 4. Integer values compress especially well because the location of the one bits after the XOR operation is often the same for the whole time series, meaning most values have the same number of trailing zeros.
这种压缩算法同时使用了前序值和前序XOR值。如图 4 所示,由于 XOR 值的序列通常具有非常相似数量的前导零和尾随零,因此最终的结果会有较好的压缩率。这种算法对于整型的压缩效果尤其好,这是因为经过 XOR 运算后的中间段位的位置一般在整个时间序列中对齐的,意味着大多数XOR值有相同个数的尾随零。
One trade-off that is inherent in our encoding scheme is the time span over which the compression algorithm operates. Using the same encoding scheme over larger time periods allows us to achieve better compression ratios. However, queries that wish to read data over a short time range might need to expend additional computational resources on decoding data. Figure 6 shows the average compression ratio for the time series stored in ODS as we change the block size. One can see that blocks that extend longer than two hours provide diminishing returns for compressed size. A two-hour block allows us to achieve a compression ratio of 1.37 bytes per data point.
我们的编码方案有一个折衷是压缩算法运行的时间跨度。 在更长的时间段内使用相同的编码方案可以让我们获得更好的压缩比。但是,这会导致在短时间内读取数据的操作可能需要在解码数据上花费额外的计算资源。图 6 显示了存储在 ODS 中的时间序列在不同数据块大小下的平均压缩率。可以看出,块大小超过两个小时之后,数据的压缩收益率是逐渐减少的。两小时的数据块使得我们能够实现每个数据点占用大约 1.37 个字节。
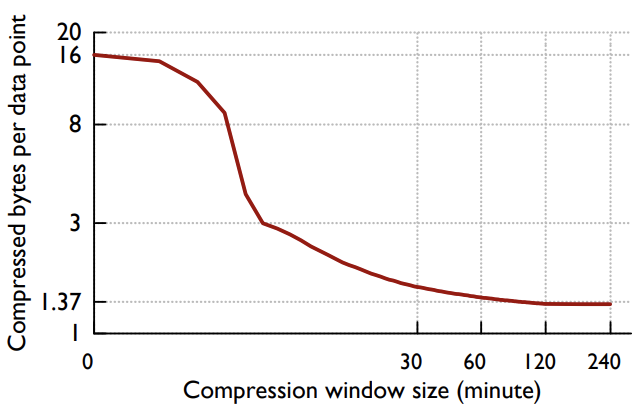
Figure 6: Average bytes used for each ODS data point as the compression bucket is varied from 0 (no compression) to 240 minutes. Bucket size larger than two hours do not give significant additional compression for our dataset. This is across the entire production Gorilla data set (approximately 2 billion time series).
图 6:每个 ODS 数据点所占用的平均字节数,因为压缩桶(数据块)从 0(无压缩)到 240 分钟不等。 大于两个小时的桶大小不会为我们的数据集提供明显的压缩效果。 这是整个生产 Gorilla 数据集(大约 20 亿个时间序列)。
4.2、内存数据结构
The primary data structure in Gorilla’s implementation is a Timeseries Map (TSmap). Figure 7 provides an overview of this data structure. TSmap consists of a vector of C++ standard library shared-pointers to time series and a caseinsensitive, case-preserving map from time series names to the same. The vector allows for efficient paged scans through all the data, while the map enables constant time lookups of particular time series. Constant time lookup is necessary to achieve the design requirement for fast reads while still allowing for efficient data scans.
Gorilla 实现中的主要数据结构是时间序列 Map (TSmap)。 图 7 提供了该数据结构的概述。 时间序列图包含一个 C++ 标准库中的 vector ,它是一个指向时间序列的指针;还包含一个 map ,其中 key 位时间序列的名称,不区分大小写并且保留原有大小写,值是和 vector 中一样的指针。vector 可以实现全数据分页查询,而 map 可以支撑指定时间序列的定长时间段查询,要满足快速查询的需求必须要具备恒定时间的查询能力,同时也要满足有效的数据扫描。
The use of C++ shared-pointers enables scans to copy the vector (or pages thereof) in a few microseconds, avoiding lengthy critical sections that would impact the flow of incoming data. On deletion of a time series, a vector entry is tombstoned, and the index is placed in a free pool which is re-used when new time series are created. Tombstoneing a section of memory marks it as ’dead’, and ready to be reused, without actually freeing it to the underlying system.
使用 C++ 共享指针可以在扫描时能够仅用几微秒内就复制整个 vector(或者其中的几页),避免冗长数据对传入的数据流产生影响。删除时间序列时,它的 vector 被标记为 “墓碑状态” ,它的索引会被放到一个空闲迟中,当创建新的时间序列时会被复用。”墓碑状态” 实际上是将一段内存标记为 “死亡” ,并准备好被复用,实际上并未将其释放到底层系统。
Concurrency is attained with a single read-write spin lock protecting map and vector access and 1-byte spin lock on each time series. Since each individual time series has a relatively low write throughput, the spin lock has very low contention between reads and writes.
每个时间序列上有一个读写自旋锁用于保护对 map 和 vector 的并发访问。由于单个时间序列具有相对较低的写入吞吐量,因此自旋锁在读取和写入间的竞争非常低。
As illustrated in Figure 7, the mapping of shard identifier (shardId) to TSmap, named ShardMap, is maintained with a vector of pointers to the TSmaps. Mapping of a time series name to a shard is done using the same caseinsensitive hash in the TSmap, mapping it to an ID between [0, NumberOfShards]. Since the total number of shards in the system is constant and numbering in the low thousands, the additional overhead of storing null pointers in the ShardMap is negligible. Like the TSmaps, concurrent access to the ShardMap is managed with a read-write spin lock.
如图 7 所示,分片唯一标识 (shardId) 与 TSmap 的映射存储在 ShardMap 中,它是一个存储了 TSmaps 指针的 vector。时间序列名称到分片的映射使用了与 TSmap 中一样的对大小写不敏感的哈希算法,哈希后的值位于 [0, NumberOfShards] 之间。由于系统中分片的数量固定,并且总量只有几千个,因此在 ShardMap 中存储空指针的额外开销可以忽略不计。 与 TSmap 一样,对 ShardMap 的并发访问也是由读写自旋锁管理。
Since the data are already partitioned by shard, individual maps remain sufficiently small (about 1 million entries), the C++ standard library unordered-map has sufficient performance, and there have been no issues with lock contention.
由于数据已经被 shard 分区,单个 map 仍然可以足够小(大约 100 万个条目),C++ 标准库 unordered-map 具有足够好的性能,并且不会发生锁争用的问题。
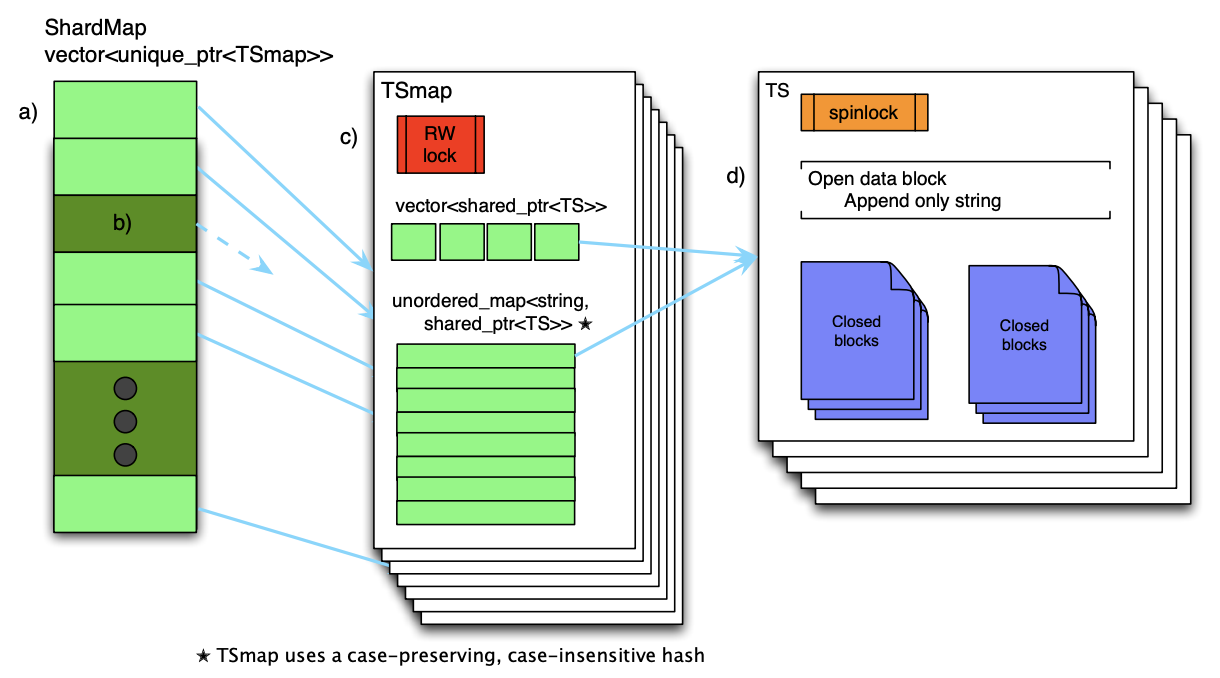
Figure 7: Gorilla in-memory data structure.
图 7:Gorilla 内存数据结构。
- a) On a query, first the TSmap pointer is examined.
- b) if the pointer is null, it means this Gorilla host does not own the shard. If non-null,
- c) then the TSmap is read-locked, and the pointer to the time series structure (TS) is found in the unordered map and copied out. At this point, both RW locks can be unlocked.
- d) Next, the TS spinlock is locked, and data for the query time range can be directly copied out of the TS.
- a) 在查询时,首先检查 TSmap 指针。
- b) 如果指针为空,则表示此 Gorilla 主机不拥有该分片。
- c) 如果指针非空,则 TSmap 被读锁定,并且在无序映射中找到指向时间序列结构 (TS) 的指针并复制出来。 此时,两个 RW 锁都可以解锁。
- d) 接下来,TS 自旋锁被锁定,查询时间范围的数据可以直接从 TS 中复制出来。
A time series data structure is composed of a sequence of closed blocks for data older than two hours and a single open data block that holds the most recent data. The open data block is an append-only string, to which new, compressed time stamps and values are appended. Since each block holds two hours of compressed data, the open block is closed once it is full. Once a block is closed, it is never changed until it is deleted out of memory. Upon closing, a block is copied to memory allocated from large slabs to reduce fragmentation. While the open block is often reallocated as it changes sizes, we find that the copy process reduces the overall fragmentation within Gorilla.
时间序列的数据结构有两个组成部分:一部分是两小时以上数据的封闭块,一部分是保存最新数据的开放块。开放块是一个只追加的字符串,新的时间戳和值压缩后会追加到这个字符串上。由于每个块置存储两个小时的压缩数据,因此开发块一旦满了之后就会封闭,一个块被关闭后它就永远不会被改变,知道将它从内存中删除。关闭块时,会根据使用的 slab 总大小分配出一个新的数据块存储数据,虽然开放的数据块在改变大小时也会重新分配,但是我们发现通过这种方式能够减少 Gorilla 的整体内存碎片。
Data is read out by copying the data blocks that could contain data for the queried time range directly into the output remote procedure call structure. The entire data block is returned to the client, leaving the decompression step to be done outside Gorilla.
通过将可能包含查询时间范围内数据的数据块直接复制到远程调用的数据结构中来读取数据。 将整个数据块返回给客户端,使得解压的过程可以在 Gorilla 外完成。
4.3、磁盘数据结构
One of our goals for Gorilla is to survive single host failures. Gorilla achieves persistence by storing data in GlusterFS, a POSIX-compliant, distributed file system [4] with 3x replication. HDFS or other distributed file systems would have sufficed just as easily. We also considered single host databases such as MySQL and RocksDB but decided against these because our persistency use case did not require a database query language.
Gorilla 的目标之一是能够应对单机故障。Gorilla 通过将数据存储在 GlusterFS 中来实现持久性,GlusterFS 是一种符合 POSIX 的支持三副本复制的分布式文件系统 [4]。HDFS 或者其他的分布式文件系统也同样可以应对单机故障。我们还考虑了 MySQL 和 RocksDB 等单机数据库,不过最终还是决定不使用这类数据库,因为我们的持久化场景中不会使用数据库查询语音。
A Gorilla host will own multiple shards of data, and it maintains a single directory per shard. Each directory contains four types of files: Key lists, append-only logs, complete block files, and checkpoint files.
Gorilla 主机将拥有多个数据分片,并且每个分片维护一个目录。 每个目录包含四种类型的文件:key 列表、 append-only 日志、完整块文件和 checkponit 文件。
The key list is simply a map of the time series string key to an integer identifier. This integer identifier is the index into the in-memory vector. New keys are append to the current key list, and Gorilla periodically scans all the keys for each shard in order to re-write the file.
Key 列表只是时间序列字符串键名到整数标识符的映射。这个整数标识符是内存中 vector 的索引下标。新的密钥会被追加到当前密钥列表中,Gorilla 会定期扫描每个分片的所有密钥,以便重新写入文件。
As data points are streamed to Gorilla, they are stored in a log file. The time stamps and values are compressed using the format described in Section 4.1. However, there is only one append-only log per shard, so values within a shard are interleaved across time series. This difference from the in memory encoding means that each compressed time stampvalue pair is also marked with it’s 32-bit integer ID, adding significant storage overhead to the per-shard log file.
当数据点流式传输到 Gorilla 时,它们会被存储在日志文件中。 时间戳和值会被按照第 4.1 节中描述的格式进行压缩。 但是,每个分片只有一个 append-only 日志,因此数据会交叉跨越多个时间序列。和内存编码不同的是,每个时间戳和值还要加上 32 位的整型 ID 进行标记,所以相比之下,每个分片上的日志文件会增加明显的存储开销。
Gorilla does not offer ACID guarantees and as such, the log file is not a write-ahead-log. Data is buffered up to 64kB, usually comprising one or two seconds worth of data, before being flushed. While the buffer is flushed on a clean shutdown, a crash might result in the loss of small amounts of data. We found this trade-off to be worth the data loss, as it allowed higher data rate to be pushed to disk and higher availability for writes compared with a traditional write-ahead log.
Gorilla 不提供 ACID 保证,因此,日志文件不是 WAL 日志。 在被刷新之前,数据缓冲高达 64kB,这通常会包含一到两秒的数据。 虽然在正常退出系统时缓冲区中的数据会被刷到磁盘,但是当发生异常崩溃时可能会导致少部分的数据丢失。相比于传统的 WAL 日志的收益,由于这种方式能够实现以更高的速率将数据写入磁盘并提供更高的写入可用性,因此我们认为这个取舍是值得的。
Every two hours, Gorilla copies the compressed block data to disk, as this format is much smaller than the log files. There is one complete block file for every two hours worth of data. It has two sections: a set of consecutive 64kB slabs of data blocks, copied directly as they appear in memory, and a list of <time series ID, data block pointer> pairs. Once a block file is complete, Gorilla touches a checkpoint file and deletes the corresponding logs. The checkpoint file is used to mark when a complete block file is flushed to disk. If a block file was not successfully flushed to disk when it on a process crash, when the new process starts up, the checkpoint file will not exist, so the new process knows it cannot trust the block file and will instead read from the log file only.
每隔两个小时,Gorilla 就会将压缩块数据复制到磁盘,因为这种格式的数据比日志文件小得多。 每两小时的数据就有一个完整的块文件。 它有两个部分:一组连续的 64kB 数据块,他们直接从内存中复制而来,以及一系列由 <时间序列ID,数据块指针> 组成的键值对。一旦某个块文件完全刷到磁盘,Gorilla 就会记录一个 checkpoint 文件并删除相应的日志。checkpoint 文件用来标记一个完整的数据块什么时候被刷到磁盘。如果在遇到进程崩溃时块文件没有被成功刷到磁盘,那么在新的进程启动时对应的 checkpoint 文件是不存在的,因此这个时候每次启动新的进程时除了读取块文件之外,还会从日志文件中读取 checkpoint 之后的数据。
4.4、故障处理
For fault tolerance, we chose to prioritize tolerating single node, temporary failures with zero observable downtime and large scale, and localized failures (such as a network cut to an entire region). We did this because single node failures happen quite often, and large scale, localized failures become a concern at Facebook’s scale to allow the ability to operate under natural (or human-caused) disasters. There is the added benefit that one can model rolling software upgrades as a set of controlled, single node failures, so optimizing for this case means hassle-free and frequent code pushes. For all other failures, we chose trade-offs that, when they do cause data-loss, will prioritize the availability of more recent data over older data. This is because we can rely on the existing HBase TSDB system to handle historical data queries, and automated systems that detect level changes in time series are still useful with partial data, as long as has the most recent data.
对于容错,我们选择优先考虑单节点故障、可感知到的零停机时间和大规模的临时故障,以及局部故障(例如网络切断到整个区域)。 我们这样做是因为单节点故障经常发生,并且大规模的局部故障已经成为 Facebook 比较关注的问题,我们需要有应对自然或人为灾害的能力。还有一个额外的好处是,可以将滚动式的软件升级模拟为一组可控的单节点故障,因此针对这种情况进行优化意味着我们可以轻松且频繁的进行代码推送。 对于其它故障我们选择折衷处理,如果故障会引起数据丢失,将优先考虑最近数据的可用性而不是老数据,这是因为对历史数据的查询可以依赖已有的 Hbase TSDB,一些自动化系统检测时间序列的变化对部分数据仍然有用,只要有最新的数据产生就会有新老数据比较。
Gorilla ensures that it remains highly available to data center faults or network partitions by maintaining two completely independent instances in separate data center regions. On a write, data is streamed to each Gorilla instance, with no attempt to guarantee consistency. This makes largescale failures easy to handle. When an entire region fails, queries are directed at the other until the first has been back up for 26 hours. This is important to handle large scale disaster events, whether actual or simulated [21]. For example, when the Gorilla instance in region A completely fails, both reads and writes to that region will also fail. The read failures will be transparently retried to the Gorilla instance in the healthy region B. If the event lasts long enough (more than one minute), data will be dropped from region A, and requests will not be retried. When this happens, all reads can be turned off from region A until the cluster has been healthy for at least 26 hours. This remediation can be performed either manually or automated.
Gorilla 通过在不同的数据中心区域维护两个完全独立的实例,来确保在数据中心故障或网络分区的情况下的高可用。在写入时,数据会流式传输到每个 Gorilla 实例,并且不会去尝试保证数据的一致性。这就使得大规模故障比较容易处理。当整个区域出现故障时,查询将直接指向另一个区域,直到第一个区域已经备份了 26 小时的数据。这在处理大规模灾难时非常重要,无论是实际的还是模拟的 [21]。例如,当区域 A 中的 Gorilla 实例完全挂掉时,对该区域的读取和写入也会失败。失败的读取将会被透明地重试路由到健康区域 B 中的 Gorilla 实例。如果故障持续时间足够长(超过一分钟),数据将从区域 A 丢弃,并且不会重试请求。发生这种情况时,可以关闭区域 A 的所有读取,直到区域 A 的集群恢复健康并且运行了至少 26 小时。这种处理方式在故障发生时可以手动或自动执行。
Within each region, a Paxos-based [6, 14] system called ShardManager assigns shards to nodes. When a node fails, ShardManager distributes its shards among other nodes in the cluster. During shard movement, write clients buffer their incoming data. The buffers are sized to hold 1 minute of data, and points older than a minute are discarded to make room for newer data. We have found that this time period is sufficient to allow shard reassignment in most situations, but for extended outages, it prioritizes the most recent data, as more recent data is intuitively more useful for driving automated detection systems. When a Gorilla host α in region A crashes or goes down for any reason, writes are buffered for at least 1 minute as the Gorilla cluster tries to resurrect the host. If the rest of the cluster is healthy, shard movement happens in thirty seconds or less, resulting in no data loss. If the movement does not occur fast enough reads can be pointed to the Gorilla instance in region B, either in a manual or automated process.
在每个区域内都有一个基于 Paxos [6, 14] 的 ShardManager 系统来将分片分配给节点。当一个节点发生故障时,ShardManager 会将这个节点的分片分发给集群中的其他节点。在分片迁移期间,写入的数据会先缓存在客户端的缓冲区。缓冲区的大小可保存 1 分钟的数据,超过 1 分钟的数据将被丢弃,以便为较新的数据腾出空间。我们发现,在大多数情况下,这段时间足以允许重新分配分片,但对于需要长时间的中断的情况,它会优先考虑最近的数据,因为数据越新,从直观上来看对操作自动检测系统来说会更有用。当区域 A 中的 Gorilla 主机 α 因任何原因崩溃或宕机时,在 Gorilla 集群尝试复活主机时,写入将被缓冲至少 1 分钟。如果集群的其余主机是健康的,分片迁移会在 30 秒或更短的时间内触发,这不会导致数据丢失。如果迁移速度不够快,则可以手动或自动过程将读取指向区域 B 中的 Gorilla 实例。
When shards are added to a host, it will read all the data from GlusterFS. These shards may have been owned by the same host before the restart or another. A host can read and process all the data it needs to be fully functional in about 5 minutes from GlusterFS. Because of the number of shards in the system and the total data stored, each shard represents about 16GB of on-disk storage. This can be read from GlusterFS in just a few minutes, as the files are spread across several physical hosts. While the host is reading the data, it will accept new incoming data points and put them into a queue to be processed at the earliest possible time. When shards are reassigned, clients immediately drain their buffers by writing to the new node. Going back to the Gorilla host α in region A crashing example: when α crashes, the shards are reassigned to host β in the same Gorilla instance. As soon as host β is assigned the shards, it begins accepting streaming writes, so no data loss occurs for in-flight data. If Gorilla host α is going down in a more controlled manner, it flushes all data to disk before exiting, so no data is lost for software upgrades.
当分片被分配到某台主机时,它将从 GlusterFS 读取所有数据。这些分片可能在重新启动之前(或其他主机之前)由同一主机拥有。新主机从GlusterFS读取和处理完整可用的数据大约需要5分钟时间,这是因为系统中的分片数量和存储的总数据量,每个分片代表大约 16GB 的磁盘存储空间。这可以在几分钟内从 GlusterFS 读取,因为文件分布在多个物理主机上。当主机读取数据时,它将接受新的传入数据点并将它们放入队列中以便尽早处理。重新分配分片时,客户端会立即通过写入新节点来耗尽其缓冲区。回到区域 A 中的 Gorilla 主机 α 崩溃示例:当 α 崩溃时,分片被重新分配给同一 Gorilla 实例中的主机 β。一旦主机 β 被分配了分片,它就开始接受流式写入,因此传输中的数据不会发生数据丢失。如果 Gorilla 主机 α 以更可控的方式出现故障,它会在退出之前将所有数据刷新到磁盘,因此不会因软件升级而丢失任何数据。
In our example, if host α crashes before successfully flushing its buffers to disk, that data will be lost. In practice, this happens very rarely, and only a few seconds of data is actually lost. We make this trade-off to accept a higher throughput of writes and to allow accepting more recent writes sooner after an outage. Also, we monitor this situation, and are able to point reads at the more healthy region.
在我们的示例中,如果主机 α 在数据刷盘成功之前挂掉,数据就会丢失。实际上,这种情况很少发生,即使发生了通常也只会丢失几秒钟的数据。 我们做出这种权衡是为了接受更高的写入吞吐量,并允许在中断后更快地接受更新的写入。 此外,我们也有这种情况的监控,并能够在故障发生后将读取指向更健康的区域节点。
Note that after a node failure, shards will be partially unavailable for reads until the new nodes hosting these shards read the data from disk. Queries will return partial data (blocks are read most recent to least recent) and will mark the results as partial.
要注意的是,当节点故障时有些分片可能有部分数据不可读,要等到新的节点将这些分片的数据完全从磁盘读取出来。查询可能只返回部分数据(块文件的读取顺序按时间从近到远)并在结果中标记为部分数据。
When the read client library receives a partial result from its query to the Gorilla instance in region A, it will retry fetching the affected time series from region B and keep those results if they are not partial. If both region A and region B return partial results, both partial results are returned to the caller with a flag set that some error caused incomplete data. The caller can then decide if it has enough information to continue processing the request or if it should fail outright. We make this choice because Gorilla is most often used by automated systems to detect level changes in time series. These systems can function well with only partial data, as long as it is the most recent data.
当读取客户端库从区域 A 中的 Gorilla 实例的查询中接收到部分结果时,它将重新尝试从区域 B 中获取受影响的时间序列,并保留这些结果(如果它们不是部分结果)。 如果区域 A 和区域 B 都返回部分结果,则两个部分结果都将返回给调用者,并设置一个标志,表明由于某些错误导致数据不完整。 然后调用者可以决定它是否有足够的信息来继续处理请求,或者它是否应该彻底失败。 我们做出这个选择是因为自动化系统最常使用 Gorilla 来检测时间序列中的水平变化。 只要是最新数据,这些系统就可以仅使用部分数据便运行良好。
Automatic forwarding of reads from an unhealthy host to a healthy one means that users are protected from restarts and software upgrades. We find that upgrading the version of software causes zero data drops, and all reads continue to be served successfully with no manual intervention. This also allows Gorilla to transparently serve reads across server failures ranging from a single node to an entire region [21].
将读取从不健康的主机自动转发到健康的主机意味着保护用户免受重新启动和软件升级的影响。 我们发现升级软件版本不会导致数据丢失,并且所有读取都会成功,这无需人工干预。 这也允许 Gorilla 无感地提供跨服务器故障的读取,范围从单个节点到整个区域 [21]。
Finally, we still use our HBase TSDB for long-term storage of data. If all in-memory copies of data are lost, our engineers can still query the more durable storage system to do their analysis and drive ad-hoc queries, and Gorilla can still drive real-time detection of level changes, once it is restarted and accepting new writes.
最后,我们仍然使用我们的 HBase TSDB 来长期存储数据。 如果所有内存中的数据副本都丢失了,我们的工程师仍然可以查询更持久的存储系统来进行数据分析和专门的查询,而 Gorilla 仍然可以在重启后接受新的数据写入,并继续进行实时数据检测。
5、Gorilla的新工具
Gorilla’s low latency query processing has enabled the creation of new analysis tools.
Gorilla 的低延迟查询特性推动产生了一些新的分析工具。
5.1、关联引擎
The first is a time series correlation engine that runs within Gorilla. Correlation search allows users to perform interactive, brute-force search on many time series, currently limited to 1 million at a time.
首先是一个运行在 Gorilla 上的时间序列关联引擎。 关联搜索允许用户对许多时间序列执行交互式暴力搜索,目前一次限制为 100 万。
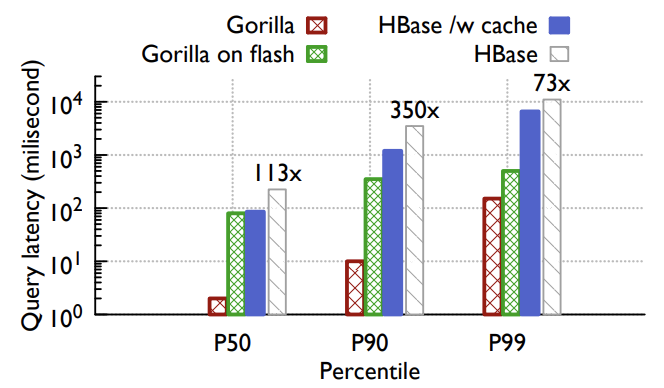
Figure 8: Total query latency breakdown with different TSDB solutions for ODS. Comparing to HBase, Gorilla has provided between 73x and 350x improvement, depending on the query size. This plot also includes preliminary results of two other options: Gorilla using flash to store data older than 26 hours, and HBase with ODS cache.
图 8:针对 ODS 的不同的 TSDB 解决方案的总查询延迟细分。 与 HBase 相比,Gorilla 提供了 73 倍到 350 倍的改进,具体取决于查询大小。 该图还包括其他两个选项的初步结果:Gorilla 使用闪存存储超过 26 小时的数据,以及使用 ODS 缓存的 HBase。
The correlation engine calculates the Pearson ProductMoment Correlation Coefficient (PPMCC) which compares a test time series to a large set of time series [22]. We find that PPMCC’s ability to find correlation between similarly shaped time series, regardless of scale, greatly helps automate root-cause analysis and answer the question “What happened around the time my service broke?”. We found that this approach gives satisfactory answers to our question and was simpler to implement than similarly focused approaches described in the literature[10, 18, 16].
关联引擎通过将测试时间序列与大量时间序列 [22] 进行比较来计算皮尔森产品-时间相关系数(PPMCC)。我们发现 PPMCC 能够在类似形状的时间序列之间找到相关性(无论规模如何),这极大地有助于通过自动化方式分析故障的根本原因,并回答 “当服务挂掉时发生了什么”。我们发现这种方法能够给我们带来比较满意的答案,并且比相关文献中描述的类似方案更容易实现 [10,18,16]。
To compute PPMCC, the test time series is distributed to each Gorilla host along with all of the time series keys. Then, each host independently calculates the top N correlated time series, ordered by the absolute value of the PPMCC compared to the needle, and returning the time series values. In the future, we hope that Gorilla enables more advanced data mining techniques on our monitoring time series data, such as those described in the literature for clustering and anomaly detection [10, 11, 16].
为了计算 PPMCC,测试时间序列需要和全量时间序列一起分布在到每个 Gorilla 主机上。 然后,每个主机独立计算前 N 个相关时间序列,按 PPMCC 与测试数据的绝对值进行排序,并返回时间序列值。 在未来,我们希望 Gorilla 能够对我们的监控时间序列数据启用更先进的数据挖掘技术,例如文献中描述的用于聚类和异常检测的技术 [10,11,16]。
5.2、图表
Low latency queries have also enabled higher query volume tools. As an example, engineers unrelated to the monitoring team have created a new data visualization which will show large sets of horizon charts, which themselves are reductions across many time series. This visualization allows users to quickly visually scan across large sets of data to see outliers and time-correlated anomalies.
低延迟查询还启用了更大查询量的工具。 例如,与监控团队无关的工程师创建了一个新的数据可视化界面,它将显示大量的线性图表,这些图表本身就是从大量时间序列中简化计算来的。 这种可视化使用户能够快速地对大量数据进行可视化扫描,以查看异常值和与时间相关的异常现象。
5.3、聚合
Recently, we moved the roll up background process from a set of map-reduce jobs to running directly against Gorilla. Recall that ODS performs time-based aggregations (or roll up) compression on old data, which is a lossy compression that reduces data granularity [26], similar to the format used by Whisper [1]. Before Gorilla, map-reduce jobs were run against the HBase cluster, which would read all data for the past hour and output values for a new, lower granularity table. Now, a background process periodically scans all completed buckets every two hours, generating the new values for the lower granularity table. Because scanning all data in Gorilla is very efficient, this move has reduced load on the HBase cluster, as we no longer need to write all the high granularity data to disk and do expensive full table scans on HBase.
最近,我们将在后台对数据做汇总叠加的程序从一组 map-reduce 任务中迁移到了 Gorilla 上直接执行。回想一下,ODS 对旧数据执行基于时间的聚合(或汇总)压缩,这是一种降低数据粒度的有损压缩 [26],类似于 Whisper [1] 使用的格式。在 Gorilla 之前,map-reduce 作业是针对 HBase 集群运行的,该集群将读取过去一小时的所有数据的值到较低粒度的表中。现在,后台进程每两小时定期扫描所有已完成的存储桶,为较低粒度的表生成新值。 因为扫描 Gorilla 中的所有数据非常高效,这一举措减少了 HBase 集群的负载,因为我们不再需要将所有高粒度数据写入磁盘并在 HBase 上进行昂贵的全表扫描。
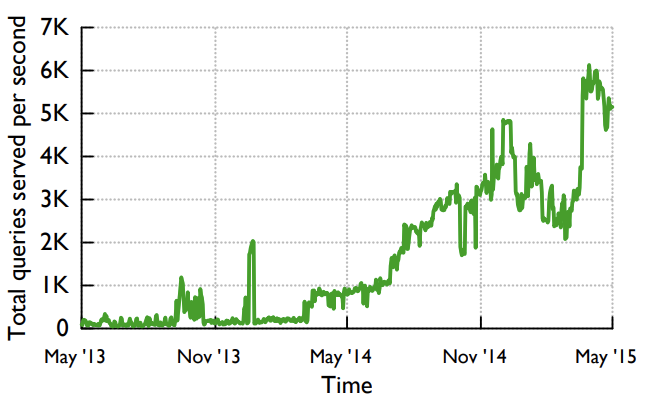
Figure 9: Growth of the total query volume since Gorilla’s introduction to ease data exploration and develop new analysis tools.
图 9:自 Gorilla 推出以简化数据探索和开发新的分析工具以来,总查询量的增长。
6、经验
6.1、容错
We next describe several planned and unplanned events that occurred over the past 6 months that affected some portion of Facebook’s site availability. We restrict ourselves to discussing the impact of these events on Gorilla as other issues are beyond the scope of this paper.
接下来,我们将介绍过去 6 个月内发生的几个预期内和预期外的事件,这些事件在一定程度上影响了 Facebook 站点的可用性。这里我们只限于讨论对 Gorilla 有影响的事件,因为其它问题超出了本文的范畴。
Network cuts. 3 unplanned events resembling network cuts/outages to some portion of machines. The cuts were automatically detected and Gorilla automatically shifted reads to the unaffected coast without any service disruption.
网络中断。 3 次预期外发生在某些机器上的类似网络中断/中断的事件。网络中断被自动检测到,Gorilla 将自动将读重定向到未受影响的区域,期间没有任何服务出现中断。
Disaster readiness. 1 planned major fire drill simulating total network cut to one storage back end. As above, Gorilla switched reads to the unaffected coast. Once the downed region was restored, Gorilla in the down region was manually remediated to pull in logs from the firedrill time frame so dashboards served out of the down region would display the expected data to end users.
灾难准备。 1 次预期内的大型故障演练,模拟整个后端存储所在处的网络全部中断。 如上所述,Gorilla 将读切换到未受影响的区域。 一旦故障区域恢复,将手动从日志文件中拉取故障时间段的数据,从而使故障区域提供的数据面板可以向最终用户展示预期内的数据。
Configuration changes and code pushes. There were 6 configuration changes and 6 code releases that required restarting Gorilla in a given region.
配置更改和代码推送。 有 6 个配置更改和 6 个代码版本需要在给定区域中重新启动 Gorilla。
Bug. A release with a major bug was pushed to a single coast. Gorilla immediately shifted load to the other region and continued serving uses until the bug was fixed. There was minimal correctness issues in the served data.
错误。 一个有重大错误的版本被推到一个区域。 Gorilla 立即将负载转移到另一个区域并继续使用,直到错误得到修复。 在输出的数据中,只有极小的数据准确性问题。
Single node failures. There were 5 single machine failures (unassociated with the major bug), causing no lost data and no remediation needed.
单节点故障。 有 5 次单机故障(与主要 bug 无关),不会导致数据丢失,也无需修复。
There were zero events in Gorilla in the last 6 months that caused anomaly detection and alerting issues. Since Gorilla launched, there has only been 1 event that disrupted realtime monitoring. In all cases, the long-term storage was able to act as a backup for all monitoring-related queries.
在过去的 6 个月中,Gorilla 没有出现任何引发检测异常和报警问题的事件。 自 Gorilla 推出以来,只有 1 起事件影响了实时监控。 在所有情况下,持久化存储为所有与监控相关的查询扮演备份的角色。
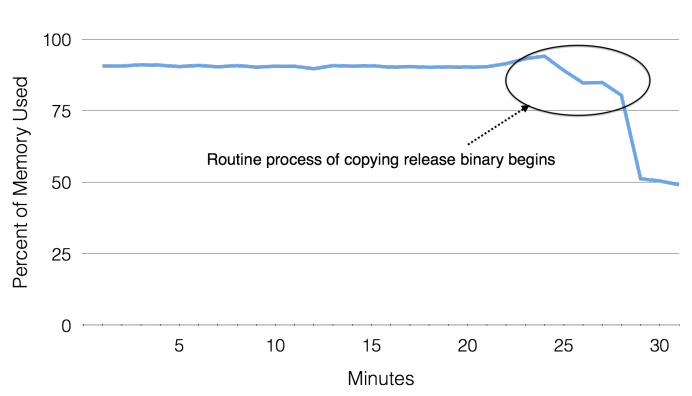
Figure 10: When searching for the root cause for a site-wide error rate increase, Gorilla’s time series correlation found anomalous events that were correlated in time, namely a drop in memory used when copying a newly released binary.
图 10:在寻找站点范围内错误率增加的根本原因时,Gorilla 的时间序列相关性发现了时间相关的异常事件,即复制新发布的二进制文件时使用的内存下降。
6.2、网站故障排查
For an example of how Facebook uses time series data to drive our monitoring, one can look at a recent issue that was detected quickly and fixed due to monitoring data, first described externally at SREcon15 [19].
对于 Facebook 如何使用时间序列数据来支持我们的监控的示例,可以看看最近一个依靠监控数据来快速检测和修复的问题,我们在 SREcon15 [19] 上首次外对介绍了这次事件。
A mysterious problem resulted in a spike in the site wide error rate. This error rate was visible in Gorilla a few minutes after the error rate spike and raised an alert which notified the appropriate team a few minutes later [19]. Then, the hard work began. As one set of engineers mitigated the issue, others began the hunt for a root cause. Using tools built on Gorilla, including a new time series correlation search described in Section 5, they were able to find that the routine process of copying the release binary to Facebook’s web servers caused an anomalous drop in memory used across the site, as illustrated in Figure 10. The detection of the problem, various debugging efforts and root cause analysis, depended on time series analysis tools enabled by Gorilla’s high performance query engine.
一个神秘的问题导致站点范围内的错误率飙升。 这个问题在错误率飙升几分钟后在 Gorilla 中被观测到,并在几分钟后发出警报通知相应的团队 [19]。 然后,艰苦的工作开始了。 随着一组工程师缓解了这个问题,其他人也开始寻找根本原因。 通过使用基于 Gorilla 构建的工具,包括第 5 节中介绍的时间序列关联索引,他们发现将发布的二进制包复制到 Facebook 的 Web 服务器的过程导致整个站点使用的内存异常下降,如图 10 所示。问题的检测、各种调试工作和故障原因的分析都依赖于 Gorilla 的高性能查询引擎所支持的时间序列分析工具。
Since launching about 18 months ago, Gorilla has helped Facebook engineers identify and debug several such production issues. By reducing the 90th percentile Gorilla query time to 10ms, Gorilla has also improved developer productivity. Further by serving 85% of all monitoring data from Gorilla, very few queries must hit the HBase TSDB [26], resulting in a lower load on the HBase cluster.
自大约 18 个月前推出以来,Gorilla 已经帮助 Facebook 工程师识别和排查了几个类似的生产环境问题。 通过将 90% 的 Gorilla 查询时间减少到 10 毫秒,Gorilla 还提高了开发人员的工作效率。 此外,通过为 Gorilla 提供 85% 的所有监控数据,很少有查询必须命中 HBase TSDB [26],从而降低了 HBase 集群的负载。
6.3、经验教训
Prioritize recent data over historical data. Gorilla occupies an interesting optimization and design niche. While it must be very reliable, it does not require ACID data guarantees. In fact, we have found that it is more important for the most recent data to be available than any previous data point. This led to interesting design trade-offs, such as making a Gorilla host available for reads before older data is read off disk.
重点考虑最近的数据而不是历史数据。 Gorilla 在优化和设计定位上比较独特。 虽然它必须得非常可靠,但它不需要 ACID 数据保证。 事实上,我们发现提供最新数据比任何以前的数据点都更重要。 这导致了有趣的设计权衡,例如在将旧数据从磁盘上读取之前要保持 Gorilla 主机的读取可用性。
Read latency matters. The efficient use of compression and in-memory data structures has allowed for extremely fast reads and resulted in a significant usage increase. While ODS served 450 queries per second when Gorilla launched, Gorilla soon overtook it and currently handles more than 5,000 steady state queries per second, peaking at one point to 40,000 peak queries per second, as seen in Figure 9. Low latency reads have encouraged our users to build advanced data analysis tools on top of Gorilla as described in Section 5.
读取延迟很重要。 高效的数据压缩和内存的数据结构极大的加快了数据读取的速度,并且推动增加了很多使用场景。当 Gorilla 推出时 ODS 每秒支撑 450 次查询,很快 Gorilla 就超过了它,目前每秒处理超过 5000 次常规查询业务,峰值时达到每秒 40000 的查询,如图9所示。低延时的读取鼓励我们的用户在 Gorilla 之上构建更高级的数据分析工具,如第 5 节的描述。
High availability trumps resource efficiency. Fault tolerance was an important design goal for Gorilla. It needed to be able to withstand single host failures with no interruption in data availability. Additionally, the service must be able to withstand disaster events that may impact an entire region. For this reason, we keep two redundant copies of data in memory despite the efficiency hit.
高可用性胜过资源效率。 容错是 Gorilla 的一个重要设计目标。 它需要能够承受单机故障而不会影响数据的可用性。 此外,该服务必须能够承受可能影响整个地区的灾难事件。 出于这个原因,我们在内存中保留了两个冗余的数据副本,尽管这样对效率会有一些影响。
We found that building a reliable, fault tolerant system was the most time consuming part of the project. While the team prototyped a high performance, compressed, inmemory TSDB in a very short period of time, it took several more months of hard work to make it fault tolerant. However, the advantages of fault tolerance were visible when the system successfully survived both real and simulated failures [21]. We also benefited from a system that we can safely restart, upgrade, and add new nodes to whenever we need to. This has allowed us to scale Gorilla effectively with low operational overhead while providing a highly reliable service to our customers.
我们发现构建一个可靠的容错系统是该项目中最耗时的部分。 虽然该团队在很短的时间内制作了一个高性能、数据压缩的内存 TSDB 原型,但要使其具有容错能力,还需要几个月的努力。 然而,当系统成功地从真实和模拟故障中幸存下来时,容错的优势是显而易见的[21]。 我们还受益于一个系统,我们可以在需要时安全地重新启动、升级和添加新节点。 这使我们能够以较低的运营开销有效地扩展 Gorilla,同时为我们的客户提供高度可靠的服务。
7、未来的工作
We wish to extend Gorilla in several ways. One effort is to add a second, larger data store between in-memory Gorilla and HBase based on flash storage. This store has been built to hold the compressed two hour chunks but for a longer period than 26 hours. We have found that flash storage allows us to store about two weeks of full resolution, Gorilla compressed data. This will extend the amount of time full resolution data is available to engineers to debug problems. Preliminary performance results are included in Figure 8.
我们希望通过几种方式来扩展 Gorilla 。一种方向是在 Gorilla 内存存储和 HBase 存储之间增加一个更大的基于闪存的二级存储。这个存储用来存放每两小时生成一次的经过数据压缩之后的分片,但是总容量会比 26 小时更长,我们发现闪存可以存储约 2 周的全量无损的、 Gorilla 格式压缩后的数据,数据时段拉长对工程师们排查问题是很有用的。图 8 是初步的性能测试结果。
Before building Gorilla, ODS relied on the HBase backing store to be a real-time data store: very shortly after data was sent to ODS for storage, it needed to be available to read operations placing a significant burden on HBase’s disk I/O. Now that Gorilla is acting as a write-through cache for the most recent data, we have at least a 26 hour window after data is sent to ODS before they will be read from HBase. We are exploiting this property by rewriting our write path to wait longer before writing to HBase. This optimization should be much more efficient on HBase, but the effort is too new to report results.
在构建 Gorilla 之前,ODS 依赖 HBase 背后的存储来用作实时数据存储:在数据写入到 ODS 后不久,它就需要可用于读取操作,这对 HBase 的磁盘 I/O 造成了很大的负担。 现在 Gorilla 正在充当最新数据的直写缓存,在将数据发送到 ODS 之后,我们至少有 26 小时的时间窗口才能从 HBase 读取它们。 我们通过重写我们的写入路径以在写入 HBase 之前等待更长的时间来利用此属性。 这种优化在 HBase 上应该会更有效,但是目前这个方向还处于早期,没有相当的对比数据。
8、总结
Gorilla is a new in-memory times series database that we have developed and deployed at Facebook. Gorilla functions as a write through cache for the past 26 hours of monitoring data gathered across all of Facebook’s systems. In this paper, we have described a new compression scheme that allows us to efficiently store monitoring data comprising of over 700 million points per minute. Further, Gorilla has allowed us to reduce our production query latency by over 70x when compared to our previous on-disk TSDB. Gorilla has enabled new monitoring tools including alerts, automated remediation and an online anomaly checker. Gorilla has been in deployment for the past 18 months and has successfully doubled in size twice in this period without much operational effort demonstrating the scalability of our solution. We have also verified Gorilla’s fault tolerance capabilities via several large scale simulated failures as well as actual disaster situations—Gorilla remained highly available for both writes and reads through these events aiding site recovery.
Gorilla 是我们在 Facebook 开发和部署的一个新的内存时间序列数据库。 Gorilla 用作过去 26 小时从 Facebook 的所有系统收集的监控数据的直写缓存。在本文中,我们描述了一种新的压缩方案,它使我们能够有效地存储每分钟包含超过 7 亿个点的监控数据。此外,与我们之前的磁盘 TSDB 相比,Gorilla 使我们能够将生产查询延迟减少 70 倍以上。 Gorilla 启用了新的监控工具,包括警报、自动修复和在线异常检查器。 Gorilla 在过去 18 个月中一直在部署,并且在此期间成功地将规模翻了一番,而无需太多的运营努力证明了我们解决方案的可扩展性。我们还通过几次大规模模拟故障以及实际灾难情况验证了 Gorilla 的容错能力——通过这些事件帮助站点恢复,Gorilla 在写入和读取方面保持高度可用。
9、致谢
Lots of thanks to Janet Wiener, Vinod Venkataraman and the others who reviewed early drafts of this paper to find typos and incorrect information.
非常感谢 Janet Wiener、Vinod Venkataraman 和其他审阅本文早期草稿以发现错别字和不正确信息的人。
Huge thanks to Sanjeev Kumar and Nathan Bronson, who had great insights into framing the paper to make it read better.
非常感谢 Sanjeev Kumar 和 Nathan Bronson,他们在设计论文以使其更好地阅读方面有深刻的见解。
Thank you to Mike Nugent, who had the brilliant idea to use PPMCC to find root causes and effects caused by interesting time series, and hacked a prototype together so quickly.
感谢 Mike Nugent,他有一个绝妙的主意,使用 PPMCC 找到有趣的时间序列引起的根本原因和影响,并如此迅速地破解了一个原型。
Of course, thanks to the current ODS team (Alex Bakhturin, Scott Franklin, Ostap Korkuna, Wojciech Lopata, Jason Obenberger, and Oleksandr Voietsa), and ODS alumnus (Tuomas Pelkonen and Charles Thayer) who have made monitoring Facebook’s infrastructure so much fun over the last few years. You guys are awesome!
当然,感谢当前的 ODS 团队(Alex Bakhturin、Scott Franklin、Ostap Korkuna、Wojciech Lopata、Jason Obenberger 和 Oleksandr Voietsa)和 ODS 的校友(Tuomas Pelkonen 和 Charles Thayer),他们让监控 Facebook 的基础设施变得如此有趣 最近几年。 你们真棒!
10、参考文献
[1] Graphite - Scalable Realtime Graphing. http://graphite.wikidot.com/. Accessed March 20, 2015.
[2] Influxdb.com: InfluxDB - Open Source Time Series, Metrics, and Analytics Database. http://influxdb.com/. Accessed March 20, 2015.
[3] L. Abraham, J. Allen, O. Barykin, V. R. Borkar, B. Chopra, C. Gerea, D. Merl, J. Metzler, D. Reiss, S. Subramanian, J. L. Wiener, and O. Zed. Scuba: Diving into Data at Facebook. PVLDB, 6(11):1057–1067, 2013.
[4] E. B. Boyer, M. C. Broomfield, and T. A. Perrotti. GlusterFS One Storage Server to Rule Them All. Technical report, Los Alamos National Laboratory (LANL), 2012.
[5] N. Bronson, T. Lento, and J. L. Wiener. Open Data Challenges at Facebook. In Workshops Proceedings of the 31st International Conference on Data Engineering Workshops, ICDE Seoul, Korea. IEEE, 2015.
[6] T. D. Chandra, R. Griesemer, and J. Redstone. Paxos Made Live: An Engineering Perspective. In Proceedings of the twenty-sixth annual ACM symposium on Principles of distributed computing, pages 398–407. ACM, 2007.
[7] H. Chen, J. Li, and P. Mohapatra. RACE: Time Series Compression with Rate Adaptivity and Error Bound for Sensor Networks. In Mobile Ad-hoc and Sensor Systems, 2004 IEEE International Conference on, pages 124–133. IEEE, 2004.
[8] B. Hu, Y. Chen, and E. J. Keogh. Time Series Classification under More Realistic Assumptions. In SDM, pages 578–586, 2013.
[9] E. Keogh, K. Chakrabarti, M. Pazzani, and S. Mehrotra. Locally Adaptive Dimensionality Reduction for Indexing Large Time Series Databases. ACM SIGMOD Record, 30(2):151–162, 2001.
[10] E. Keogh, S. Lonardi, and B.-c. Chiu. Finding Surprising Patterns in a Time Series Database in Linear Time and Space. In Proceedings of the eighth ACM SIGKDD international conference on Knowledge discovery and data mining, pages 550–556. ACM, 2002.
[11] E. Keogh, S. Lonardi, and C. A. Ratanamahatana. Towards Parameter-Free Data Mining. In Proceedings of the tenth ACM SIGKDD international conference on Knowledge discovery and data mining, pages 206–215. ACM, 2004.
[12] E. Keogh and C. A. Ratanamahatana. Exact Indexing of Dynamic Time Warping. Knowledge and information systems, 7(3):358–386, 2005.
[13] I. Lazaridis and S. Mehrotra. Capturing Sensor-Generated Time Series with Quality Guarantees. In Data Engineering, 2003. Proceedings. 19th International Conference on, pages 429–440. IEEE, 2003.
[14] Leslie Lamport. Paxos Made Simple. SIGACT News, 32(4):51–58, December 2001.
[15] J. Lin, E. Keogh, S. Lonardi, and B. Chiu. A Symbolic Representation of Time Series, with Implications for Streaming Algorithms. In Proceedings of the 8th ACM SIGMOD workshop on Research issues in data mining and knowledge discovery, pages 2–11. ACM, 2003.
[16] J. Lin, E. Keogh, S. Lonardi, J. P. Lankford, and D. M. Nystrom. Visually Mining and Monitoring Massive Time Series. In Proceedings of the tenth ACM SIGKDD international conference on Knowledge discovery and data mining, pages 460–469. ACM, 2004.
[17] P. Lindstrom and M. Isenburg. Fast and Efficient Compression of Floating-Point Data. Visualization and Computer Graphics, IEEE Transactions on, 12(5):1245–1250, 2006.
[18] A. Mueen, S. Nath, and J. Liu. Fast Approximate Correlation for Massive Time-Series Data. In Proceedings of the 2010 ACM SIGMOD International Conference on Management of data, pages 171–182. ACM, 2010.
[19] R. Nishtala. Learning from Mistakes and Outages. Presented at SREcon, Santa Clara, CA, March 2015.
[20] R. Nishtala, H. Fugal, S. Grimm, M. Kwiatkowski, H. Lee, H. C. Li, R. McElroy, M. Paleczny, D. Peek, P. Saab, et al. Scaling Memcache at Facebook. In nsdi, volume 13, pages 385–398, 2013.
[21] J. Parikh. Keynote speech. Presented at @Scale Conference, San Francisco, CA, September 2014.
[22] K. Pearson. Note on regression and inheritance in the case of two parents. Proceedings of the Royal Society of London, 58(347-352):240–242, 1895.
[23] F. Petitjean, G. Forestier, G. Webb, A. Nicholson, Y. Chen, and E. Keogh. Dynamic Time Warping Averaging of Time Series Allows Faster and More Accurate Classification. In IEEE International Conference on Data Mining, 2014.
[24] T. Rakthanmanon, B. Campana, A. Mueen, G. Batista, B. Westover, Q. Zhu, J. Zakaria, and E. Keogh. Searching and Mining Trillions of Time Series Subsequences Under Dynamic Time Warping. In Proceedings of the 18th ACM SIGKDD international conference on Knowledge discovery and data mining, pages 262–270. ACM, 2012.
[25] P. Ratanaworabhan, J. Ke, and M. Burtscher. Fast Lossless Compression of Scientific Floating-Point Data. In DCC, pages 133–142. IEEE Computer Society, 2006.
[26] L. Tang, V. Venkataraman, and C. Thayer. Facebook’s Large Scale Monitoring System Built on HBase. Presented at Strata Conference, New York, 2012.
[27] A. Thusoo, J. S. Sarma, N. Jain, Z. Shao, P. Chakka, S. Anthony, H. Liu, P. Wyckoff, and R. Murthy. Hive: A Warehousing Solution Over a Map-Reduce Framework. PVLDB, 2(2):1626–1629, 2009.
[28] T. W. Wlodarczyk. Overview of Time Series Storage and Processing in a Cloud Environment. In Proceedings of the 2012 IEEE 4th International Conference on Cloud Computing Technology and Science (CloudCom), pages 625–628. IEEE Computer Society, 2012.
参考链接